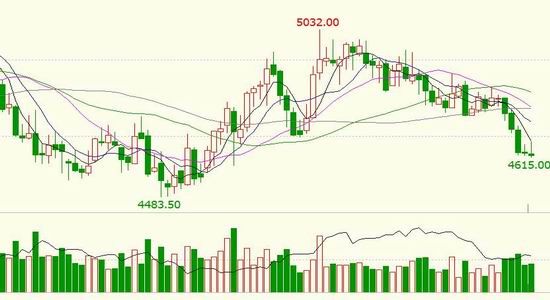
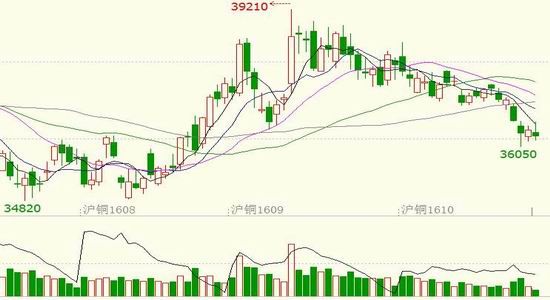
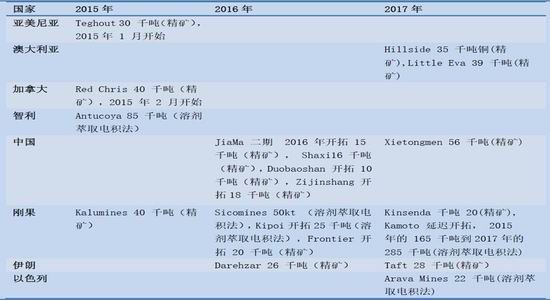
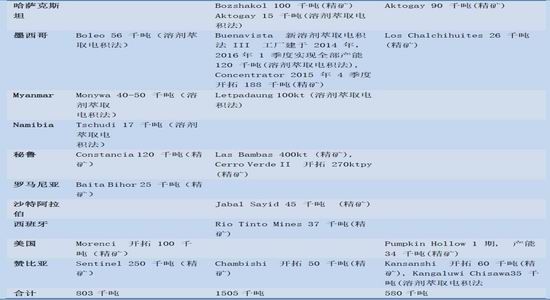
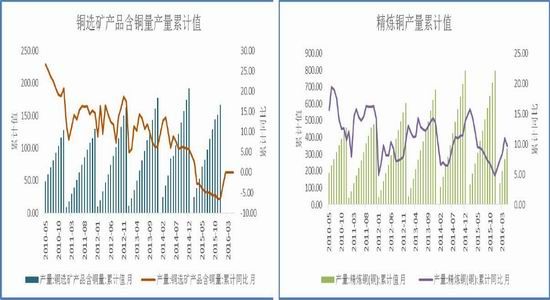
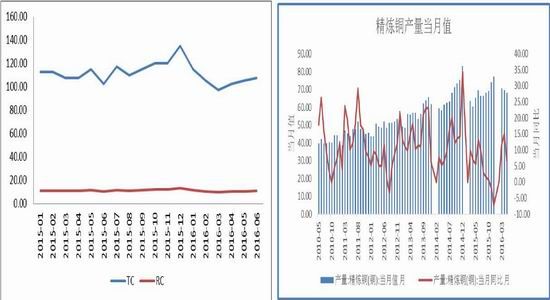
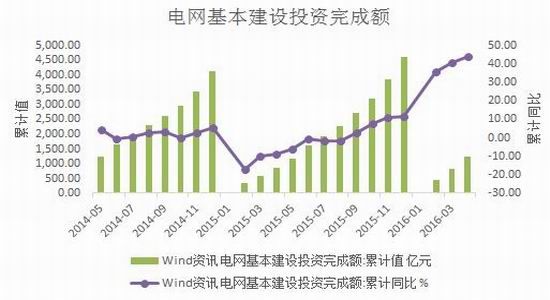
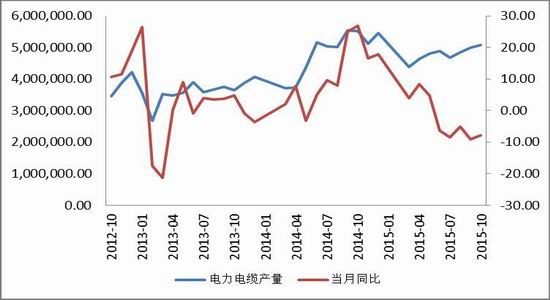
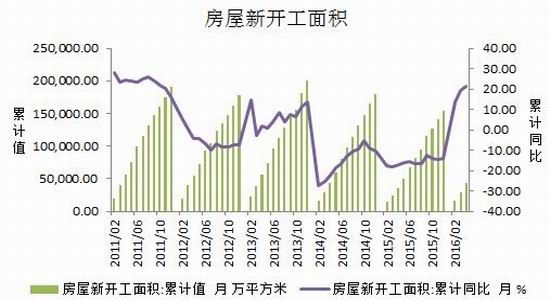
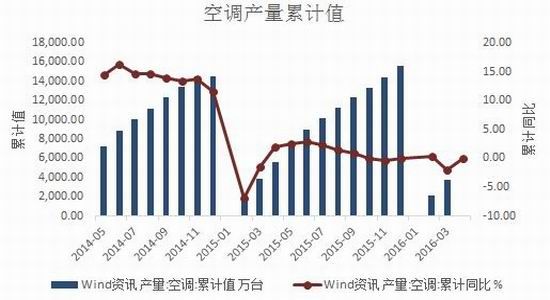
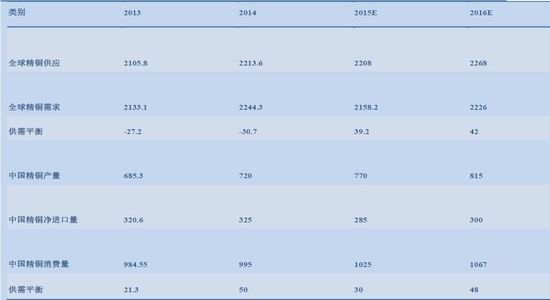
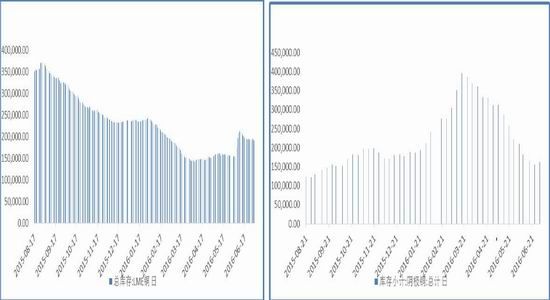
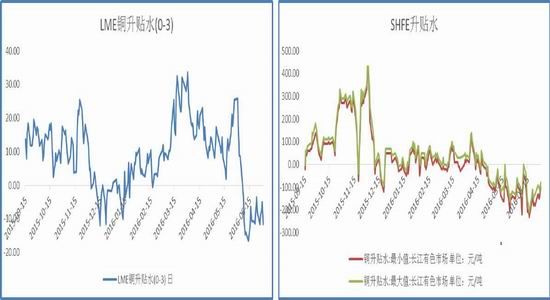
Report summary ◠Federal Reserve Chairman Yellen said at the Jackson Hole Central Bank meeting: The US economy is approaching the two goals of the Fed: full employment and stable prices. Considering the continued and robust labor market and the Fed's outlook for economic activity and inflation, it is believed that the situation in recent months has increased the likelihood of a rate hike and her concerns are fading. Although the economic growth rate is not fast, it is enough to further improve the labor market. Although Yellen’s speech has increased the market’s interest rate hike expectations, we feel that the market’s expectations for the Fed’s rate hike have been clearly overdrawn. ◠China's economic and financial data declined in July, and the added value of industrial enterprises above designated size declined slightly. However, the industrial structure was continuously optimized, and the effect of de-capacity was obvious. The decline in fixed-asset investment was partly due to the factor of de-capacity, but the decline in private investment reflected the current economic momentum. Insufficient, investment yield is too low; real estate investment data has declined, but sales data indicates that real estate sales are still strong, destocking effect continues to show, real estate growth rate is comprehensively and continuously falling, and the real estate market as a whole has been developing at a high speed. In the past, the demand for real estate real estate in the future will continue to weaken, and real estate investment will also slow down. For consumption, consumption has been maintaining high growth under the pressure of economic downturn. However, due to the popularity of real estate at the beginning of the year, it has virtually weakened the spending power of residents, and of course has a certain relationship with this year's floods and disasters. The fall in financial data is not only related to China's current neutral monetary policy, but also reflects the weak willingness of enterprises to borrow. As an important part of the Keqiang Index, there has been a large increase in power generation in July, which is also a positive signal in the economic downturn. The next step is to increase fiscal policy, especially in infrastructure. Monetary policy has remained basically stable, creating a relaxed environment for fiscal policy. ◠In the second half of the year, copper supply pressure is still relatively large, mainly from Chile, Peru and other regions, which maintains mine production by compressing operating costs. The processing fee has increased compared with the beginning of the year, and the smelter operating rate has remained high, which has led to the gradual transmission of loose copper concentrate to the refined copper market, resulting in the continued supply of refined copper. In 2016, many industries will enter the destocking stage. Due to the continuous decline of new housing starts and the completion of housing, the consumption of household appliances such as air conditioners is still weak. Although the grid investment is relatively stable, it is difficult to increase significantly. Overall, the future copper market Consumption is still weak. ◠After the short-term sharp decline in copper prices, both long and short positions have been closed. The short-term downward space is limited. The probability of maintaining shocks is too large. The previous short-term orders can partially take profit. The zinc-selling strategy can continue to be held. Part of the take profit, copper can try the positive set. ◠Possible risks: China's economic recovery, the sharp depreciation of the renminbi, and geopolitical factors have caused copper prices to fluctuate significantly. ◠Pay attention to the US new non-agricultural employment data in August First, the market review In August, the performance of basic metals was still different. The strong ones were strong, especially zinc. After a short-term correction at the beginning of the month, at the end of the month, the increase in positions increased again, breaking through the previous high, hitting a new high of 18,000 yuan, and the spot premium climbed to 100. Yuan, the lead continues to rise and lead and tin, Shanghai lead continues to attack the four-four mark, the spot continues to be strong, high water. At the end of the month, copper prices opened a round of plunging trend. The fuses for LME stocks surged 53250 tons for 4 consecutive days. The stocks were concentrated in Asia. The market worried about China's demand and the bears took pressure. A number of Fed officials said the US is close to full employment and inflation targets, the Fed is nearing the rate hike, and US new home sales data is much better than expected, and the dollar boosted. However, the initial value of Markit's manufacturing, service industry and comprehensive PMI in August was less than expected. The growth of existing home sales in July was much higher than expected, indicating that the development prospects of the US manufacturing industry are still not stable, adding obstacles to the Fed's interest rate hike and curbing the dollar's gains. The US dollar currently runs near the two-month low of 94.7. In terms of crude oil, Saudi Arabia, Iran and other countries competed to increase production. Iraq also increased crude oil exports. Crude oil inventories in the US EIA and Cushing areas rose sharply, and crude oil fell under pressure, hitting a low of 46.42 US dollars per barrel. This week, Luneng Copper fell to break all the moving averages and the lower track of Brin Road, from 4,800 US dollars / ton to the two-month low of 4,620 US dollars / ton, a weekly decline of 3.7%, holding positions first and then increased, a total of more than 2,700 hands The volume of transactions increased by more than 15,000 hands. The lower track of the Bollinger track turned downwards, and the upper moving average was close to the short position. The bears dominated the market. From August 8th to the present, Shibor continued to rise overnight, indicating that the pattern of tight capital in August has reappeared, putting bulk commodities under pressure. However, the PBOC’s open market operation for the first time in half a year has restarted the 80 billion 14-day reverse repurchase operation, together with the 14-day reverse repurchase operation of 140 billion yuan, indicating that the willingness of the PBOC to ease market funds is strong. The Shanghai-London ratio was repaired from 7.75 to 7.85, and the Shanghai copper futures were resistant. Shanghai copper followed the external disk callback, opened for several consecutive days, the short position actively increased Masukura into the market, on the 24th Masukura 28,000 hands, of which the main force Masukura 18,500 hands, Shanghai copper main force was killed down to June 27 since the low level 36050 yuan / Tons, away from all moving averages and losing the lower track of Brin Road, fortunately, the 36,000 yuan / ton integer mark was supported, the short position was closed out of the market, the main position closed 23,000 hands, Shanghai copper closed long leads, the weekly decline of 2.5%, 26 Japanese Federal Reserve Chairman Yellen’s speech is slightly hawkish, but the market has clearly reflected expectations and does not have to be pessimistic. In the spot market, the spot price at the end of the month was posted as a rise, from a discount of 80 yuan / ton - a discount of 20 yuan / ton to a flat water - premium 50 yuan / ton. The water supply source attracts traders to receive the goods, especially the discounted copper and good turnover, which drives the spot premium to climb. The copper price after the collapse of 37,000 yuan/ton led to the influx of downstream bargain hunting, and the market activity was significantly improved. The overall supply is still relatively loose, but the offer is firm, and the supply and demand are still deadlocked. In August, the overall market transactions were sluggish, trade flows declined, and the downstream continued to wait and see at high prices, keeping demand, resulting in the end of the month, and the influence of market bill factors did not significantly expand. Chart 1: LME March copper K line chart Chart 2: Shanghai copper main force K line chart Source: Guomao Futures, wind two, Macro analysis 2.1 Fed rate hike expectations have been significantly overdrawn According to data from the US Department of Commerce, the US real GDP annualized correction of the second quarter was 1.1%, which was in line with expectations. Expected 1.1%, the previous value is 1.2%. The downgrade was mainly dragged down by government spending and further reductions in stocks. Combined with the GDP growth rate of 0.83% in the first quarter, the US economic growth in the first half of the year was just 1% (specifically, 0.0096%). Most economists believe that the third quarter data will be better. The 2016 Jackson Hole Central Bank Conference was held on August 25-27. The theme of this year is to design a flexible monetary policy framework for the future. Federal Reserve Chairman Yellen and Bank of Japan Governor Haruhiko Kuroda attended the annual meeting. Yellen said that the US economy is approaching the two goals of the Fed: full employment and price stability. Considering the continued and robust labor market and the Fed's outlook for economic activity and inflation, it is believed that the situation in recent months has increased the likelihood of a rate hike. Yellen said her fears are fading. Although the economic growth rate is not fast, it is enough to further improve the labor market. Although the unemployment rate is hovering near the 5% for most of this year, the idleness of the labor market is improving. Yellen said that since the Fed officials adjusted their expectations for the economy, unemployment rate and inflation last time, the Fed’s prospects for economic data are relatively stable. Specifically, she said officials expect a modest increase in real GDP and a further improvement in the labor market, with inflation rising to 2% in the next few years. Based on the prediction of these data, the Fed believes that it is appropriate to raise interest rates at a slow rate. Fed officials’ expectations of the future economy are highly correlated with interest rate hike decisions. If the expectations worsen, then they may not stand still. Yellen is quite uncertain about the long-term level of the federal funds rate. She said that at the end of 2017, there is a 70% probability that the federal funds rate is in the 0-3.25% range; at the end of 2018, it is in the 0-4.5% range. In contrast, in the June estimates of Fed officials, the median value of the federal funds rate at the end of 2017 was 1.625%, and at the end of 2018 it was 2.375%, which is a point estimate, not an interval estimate. Yellen said that she gave such a wide range of estimates because the economy often has an impact and it is difficult to develop in the expected direction. Many of Yellen’s speeches are centered on the topic of “How the Fed acts when the future is hit.†Usually, the Fed will adopt interest rate cuts to stimulate lending, investment and spending. But when interest rates are low, the Fed does not have much room to cut interest rates. Yellen said that if there is an impact in the future, it may re-take asset purchases to lower long-term interest rates and promise low interest rates. Other tools, such as adjusting the Fed’s interest on bank reserves, may also be a long-term policy. 2.2 China's economic data has fallen back in an all-round way, and the downward pressure on the economy is increasing. According to the statistics of the Bureau of Statistics, the added value of industrial enterprises above designated size in July was 6.0% year-on-year, slightly lower than the expected 6.2%. The value added of industrial enterprises above designated size in China from January to July was 6.0%, which was the same as the previous value, in line with expectations. According to industry data, high-tech industries and equipment manufacturing industries increased rapidly, and their added value increased by 12.2% and 10.7% respectively, and the industrial structure continued to optimize. In addition, the de-capacity effect is highlighted, the Bureau of Statistics said that China's decompression excess capacity is beneficial to economic development in the long run, and China's de-capacity has contributed to the rebound in commodity prices. From the perspective of de-capacity, the output of raw coal and crude steel decreased from January to July: raw coal production decreased by 10.1% from January to July, and the decrease was 0.4 percentage points higher than that in January-June; crude steel output decreased by 0.5%. In addition, the efficiency of enterprises continued to improve. From January to June, the total profits of industrial enterprises above designated size reached 2.9998 trillion yuan, a year-on-year increase of 6.2%. From the perspective of cost, the cost per 100 yuan of main business income of industrial enterprises above designated size continued. The decrease was 85.79 yuan, a decrease of 0.21 yuan over the same period of the previous year. At the end of June, the inventory of finished products decreased by 1.9% year-on-year, falling for three consecutive months. On the whole, China's industrial production is basically stable. The year-on-year growth rate of industrial added value narrowed in July, which was in line with the previously announced decline in China's manufacturing PMI. In addition to the impact of floods and floods, market demand continued to be sluggish, and the lack of expansionary power was the main reason for the decline in industrial production. China's urban fixed asset investment from January to July was 8.1% year-on-year, with an expected 8.9% and a previous value of 9%. From January to July, private fixed assets investment grew by 2.1%, and the growth rate dropped by 0.7 percentage points from January to June. In July, the decline in fixed asset investment was larger than expected. Not only did urban fixed asset investment fall short of expectations in January-July, but it was the lowest since 1999, mainly due to the decline in mining and manufacturing industries due to de-capacity and sluggish demand. Moreover, private fixed-asset investment continued to decline. In July, private fixed-asset investment increased by -1.2% year-on-year in the first month, and it fell year-on-year for the second consecutive month. The decline in private investment is related to the expected return on investment in the real economy. It shows that the current economic momentum is insufficient. To solve the continued weakening of private investment, it is necessary to restore the expectations of entrepreneurs for economic growth. Therefore, it will take time for private investment to stabilize. However, in the long run, the slowdown in fixed asset investment growth is reasonable, and it is beneficial to adjust the structure. It is expected that the intensity of fiscal policy will increase in the second half of the year, and there is still much room for investment in infrastructure construction. The growth of follow-up investment is generally in a stable and declining pattern. According to the statistics of the Bureau of Statistics: From January to July, the national real estate development investment was 5.5361 trillion yuan, a nominal increase of 5.3% year-on-year, and the growth rate dropped 0.8 percentage points from January to June. From January to July, the newly started housing area was 92,940 square meters, an increase of 13.7%, and the growth rate dropped by 1.2 percentage points. From January to July, the sales area of ​​commercial housing was 757.6 million square meters, up 26.4% year-on-year. The growth rate dropped by 1.5 percentage points from January to June. From January to July, the sales of commercial housing was 575.69 billion yuan, up 39.8%, and the growth rate dropped by 2.3 percentage points. As of the end of July, the saleable area of ​​commercial housing was 713.82 million square meters, a decrease of 340,000 square meters from the end of June. Among them, the area for sale of residential buildings decreased by 4.15 million square meters. Sales data indicates that real estate sales are still strong, but growth is slowing. The growth rate of new construction starts continued to fall, mainly because the early demand fell back and the developers cautiously took the land. The stacking base continued to rise, which caused the land acquisition area to drop and turn negative, which also cast a shadow over future real estate investment. Real estate investment as a whole is cooling down, and real estate investment may continue to fall in the future. The decline in the growth rate of real estate investment, the main second-line housing prices, led to a rise in a number of investments, but the role has already emerged. As housing prices in first- and second-tier cities rise, the tightening of mortgage policies will also slow the growth rate of real estate investors. The above data shows that the real estate destocking effect continues to show, the real estate growth rate is comprehensively and continuously falling, and the period of rapid development of the real estate market has passed. It is expected that the real estate real estate demand momentum will continue to weaken and real estate investment will continue to fall. But in the long run, the real estate market will remain stable and healthy. According to the statistics of the Bureau of Statistics, the total retail sales of consumer goods in China in July was 10.2% year-on-year, with an expected 10.5% and a previous value of 10.6%. China's total retail sales of consumer goods from January to July was 10.3% year-on-year, with an expected 10.3% and a previous value of 10.3%. Following the year-on-year growth in consumer goods retail sales in June, the growth rate in July slowed down. In July, the consumption growth rate dropped slightly. In addition to the impact of floods and heat in some regions and weak domestic and international demand, the consumer staples overall weakened. The negative growth rate of optional oil in China expanded to 2.1%, and gold and silver jewelry also entered negative growth. Obviously, lower the overall growth rate. However, the trend of consumer institutions has not changed overall. The growth rate of rural areas continues to be faster than that of cities and towns: from January to July, the retail sales of urban consumer goods reached 157.375 billion yuan, up 10.2% year-on-year; the retail sales of rural consumer goods reached 2.5591 billion yuan, up 10.9%. In addition, the growth rate of catering continues to be faster than retail sales, and online retail sales continue to increase. But compared with investment, the foreign trade continues to shrink, and consumption is still the mainstay. China's M2 money supply in July was 10.2% year-on-year, expected to be 11.0%. July M1 money supply was 25.4% year-on-year, 24.0% expected. July M0 money supply was 7.2% year-on-year, expected 7.0%, previous value was 7.2%; new RMB in July The loan amounted to 463.6 billion yuan, which is expected to be 850 billion yuan. In July, the social financing scale was 487.9 billion yuan, which is expected to be 100 billion yuan. China’s new RMB loans and social financing in July were significantly lower than market expectations. M1-M2 scissors hit a record high, and financial support for the economy has weakened. On the one hand, due to the current overheated real estate market, China’s neutralization is moderate. The monetary policy has not implemented the policy of flooding and flooding, such as lowering interest rates, and stimulating the economy. On the other hand, in the context of the current economic downturn, corporate profitability has been greatly weakened, and even many companies have suffered losses in successive years, and corporate lending will not be strong. It is constantly reducing the financial leverage of enterprises, ensuring the normal cash flow of enterprises, and reducing operating costs to make enterprises survive. According to the published data, the economic and financial data declined in July, and the added value of industrial enterprises above designated size declined slightly. However, the industrial structure was continuously optimized, and the effect of de-capacity was obvious. The decline in fixed-asset investment was partly due to the factor of de-capacity, but private investment declined. Reflecting the current lack of economic power, investment yield is too low; real estate investment data has declined, but sales data indicates that real estate sales are still strong, destocking effect continues to show, real estate growth is comprehensively and continuously falling, real estate market as a whole The period of rapid development has passed, and the demand for real estate real estate will continue to weaken in the future, and real estate investment will also slow down. For consumption, consumption has been maintaining high growth under the pressure of economic downturn. However, due to the popularity of real estate at the beginning of the year, it has virtually weakened the spending power of residents, and of course has a certain relationship with this year's floods and disasters. The fall in financial data is not only related to China's current neutral monetary policy, but also reflects the weak willingness of enterprises to borrow. As an important part of the Keqiang Index, there has been a large increase in power generation in July, which is also a positive signal in the economic downturn. The next step is to increase fiscal policy, especially in infrastructure. Monetary policy has remained basically stable, creating a relaxed environment for fiscal policy. Third, the fundamental analysis 3.1 Copper supply pressure is still relatively large 2016-2018 is just at the peak of the construction and expansion of new copper mines. During the period, the global copper mine capacity is expected to maintain a growth rate of more than 5%. According to ICSG statistics, the global copper mine production capacity in 2015 was approximately 22.599 million tons, an increase of nearly 5.1% year-on-year. The average growth rate in 2015-2018 may reach 6.3%, mainly due to the obvious increase in copper concentrate capacity growth. The growth rate of copper (SX-EW) capacity is relatively stable. In terms of regions, Peru's copper mine capacity will increase significantly in the next two years. Kazakhstan, China and Mexico will also contribute a certain increase. In general, global copper production capacity in 2018 will reach 27.5 million tons, compared with 2015. The increase is nearly 5 million tons, and the increase is very impressive, accounting for almost one-fifth of the current total capacity. Copper mines have a long investment and construction period. Projects invested 11 years ago will basically be put into operation in 15-18 years. Other projects will be expanded. Although copper prices have fallen and squeezed their profit margins, Chile, Peru and other mines have been built. It is also significantly reducing the recurring costs, preferring layoffs and not cutting production. At present, during the downturn in copper prices, Chinese companies have gone out to acquire overseas mines. Among them, Luoyang Molybdenum acquired the antimony and phosphate assets of Anglo American Brazil in the US$1.5 billion, and later it was US$2.65 billion and up to US$120 million. There was a consideration for the acquisition of Tenke Copper and Cobalt assets in the Freeport Congo (56% interest). Recently, Jiangxi Copper has set up a subsidiary in Hong Kong with the aim of accelerating the pace of overseas acquisition of mines. Chart 5: Major Mine Projects 2015-2017 Source: Guomao Futures, ICSG Figure 6: Copper supply increases Chart 7: Global refined copper production Source: Guomao Futures, wind 3.2 Processing fees are still at a high level, and the supply pressure of refined copper is relatively high. Copper ore processing fees increased slightly in the first half of 2016, and the clean spot TC reported 100-105 US dollars / ton. According to traders, the current trading range is mainly above $103/ton. Small traders have limited supply, and big traders hold more goods, but unlike before, the phenomenon of large traders has also eased. The refinery inventory level is high, and short-term purchase sentiment is difficult to improve. A large smelter It indicates that it has not been inquired in the spot market for several weeks. For the third and fourth quarters of the spot TC is still holding a bullish attitude, but from the current market feedback, the trend of spot TC in the short term may tend to be stable. Driven by higher processing fees, smelters will still maintain a high operating rate, and refined copper production will continue to increase. It is estimated that there will be an increase of 300,000 to 350,000 tons in the second half of 2016. Whether it is crude capacity or refining capacity, China is still the focus of future growth. China's smelting capacity reached its peak in 2013. In 2014, due to the decline in profits and the elimination of backward production capacity, the growth rate declined, but the investment in mines has been growing. This is also because domestic copper concentrate resources are insufficient. Large domestic mining companies such as the industry and Zijin Mining have purchased copper mines overseas to increase the self-sufficiency rate of copper concentrates in China. China's refined copper production capacity still accounts for more than 40% of the world's total, while India's growth rate is the first, but the proportion is less than 5%. Therefore, our focus is still on the changes in China's refined copper capacity and output. According to our incomplete statistics, the new capacity of China's refined copper in 2016-2017 may be 1.585 million tons, of which the time period of production is mainly concentrated in the second half of 2016 and 2017, and some projects have even accelerated. In 2016, domestic copper smelting capacity is more likely to maintain rapid expansion. This will inevitably bury hidden dangers in future surges in production. In the next two years, domestic refined copper production will continue to grow from a general trend. This week, the spot price of clean mine TC reported 100-105 US dollars / ton, which remained flat compared with last week. However, unlike the price shift of the previous two weeks, the spot TC transaction price slightly increased this week. It is understood that the market traders offer is generally above $103/ton, and the TC can still talk about $1-2/ton after the buyers and sellers negotiate. According to a large foreign-invested trader, the slight weakening of the previous TC was mainly affected by the increase in the purchase volume of short-term smelters. The procurement of goods was mainly for goods arriving in Hong Kong in the fourth quarter, which was aimed at preparing for the fourth quarter of raw materials inventory for next year. Prepared by the negotiations. The overall inventory level of the smelter is relatively high. In the fourth quarter, the recent increase in processing fees is a normal phenomenon. Chart 8: TC/RC is still at a high level Chart 9: China's refined copper production Source: Guomao Futures, wind 3.3 The demand is still insufficient International copper industry ICSG's research on the growth of refined copper consumption in all regions of the world in 2015 shows that global copper consumption has declined slightly. China is still the main battlefield of global copper consumption, accounting for more than 48% of global consumption, while Europe and North America It can only maintain steady growth and there is no new growth point. Therefore, the trend of China's copper consumption will mainly affect the balance of supply and demand in the global copper market. China is currently in a critical period of economic restructuring, de-capacity, deleveraging, and destocking. The economic growth rate is gradually declining, but the quality of economic growth is expected to increase. Copper plays an important role in economic development and is closely related to GDP. In 2015, the global GDP growth rate showed a slight decline. In 2016, the overall growth rate was around 2.5%-3%, and China's GDP will continue to bottom out. China's 13th Five-Year Plan's GDP growth target for the next five years is 6.5%, but it may be lower. Although the Indian economy may maintain a relatively high growth rate in the future, its copper consumption ratio is low, contributing to global copper consumption. Relatively limited. In 2016, global copper consumption will continue to remain low, and China's consumption is still the top priority. From the perspective of copper consumption structure, the power industry is a large copper household. In recent years, the consumption has exceeded 45%, and the air-conditioning industry ranks second, currently about 15%. Others include construction, electronics, transportation and other industries. The investment in the State Grid began to increase, and cable production showed positive growth. In July, the grid investment was 255.991 billion yuan, a year-on-year increase of 32.53%, significantly exceeding the same period last year. The recovery of the real estate market, grid investment and power cable production will support the copper price. Although there is less direct copper consumption with real estate, there are many indirect related industries, including new home cables, air conditioners, and refrigerators, and their copper consumption accounts for half of the total. In 2015, the central bank “reduced the interest rate cuts†six times and introduced a number of real estate policies, real estate has seen a certain degree of recovery, but the vacancy rate in third- and fourth-tier cities is still high, and destocking will continue for 3-5 years. The household appliance industry is mainly the demand for air conditioners. Due to the large inventory in the real estate market, the number of air conditioners in new homes has decreased. In July, the output of air conditioners was 13.625 million units, up 10.1% year-on-year; the output of refrigerators in July was 794.90 million units, up 7.3% year-on-year. The demand for the home appliance industry has rebounded from the previous year and achieved positive growth. From the current point of view, China's power demand is declining, and the increase in grid investment in the future may gradually decrease. The real estate industry is still in the stage of destocking, the area of ​​new housing starts continues to decline, the demand of the air-conditioning industry is also weakened, and the process of gradual destocking is still in the future. Therefore, we believe that copper consumption growth will continue to slow down in the second half of 2016. Chart 10: Power and grid investment Chart 11: Power Cable Production Chart 12: Domestic real estate situation Chart 13: Air Conditioning Production Source: Guomao Futures, wind In 2016, global refined copper continued to supply surplus. The output performance of major copper producing countries in Asia has been mixed. The increase in production in China has effectively offset the decline in countries such as India and Japan. The overall output of Asia has also increased slightly. The output of major copper producing countries in North America has mostly shown a growth pattern. A certain extent of decline, the output of major copper producing countries in Europe has increased steadily, and Africa has declined due to insufficient power supply. Overall, copper production in 2015 has been affected to some extent. In 2016, global copper concentrate supply is still large. Although there are some active production reduction actions in smelters, refined copper production is still large, and downstream demand has weakened. It is expected that global refined copper will continue to be surplus. Chart 14: Global Copper Supply and Demand Balance Sheet Source: Guomao Futures, wind In terms of inventory: the global copper dominant library was 498,400 tons, an increase of 64,100 tons from last week. LME copper stocks were 271,575 tons, an increase of 62,125 tons from the end of last month. The copper stocks of the previous period were 165,803 tons, a decrease of 6,816 tons from the end of last month. Figure 15: LME Copper Stock Chart 16: SHFE Copper Stock Source: Guomao Futures, wind Spot market: At the end of the month, the spot price is posted as a rise, from a discount of 80 yuan / ton - a discount of 20 yuan / ton to a flat water - premium 50 yuan / ton. The water supply source attracts traders to receive the goods, especially the discounted copper and good turnover, which drives the spot premium to climb. The copper price after the collapse of 37,000 yuan/ton led to the influx of downstream bargain hunting, and the market activity was significantly improved. The overall supply is still relatively loose, but the offer is firm, and the supply and demand are still deadlocked. In August, the overall market transactions were sluggish, trade flows declined, and the downstream continued to wait and see at high prices, keeping demand, resulting in the end of the month, and the influence of market bill factors did not significantly expand. Figure 17: LME copper rise discount chart 18: SHFE copper stock Source: Guomao Futures, wind Fourth, the outlook of the market outlook Federal Reserve Chairman Yellen said at the Jackson Hole Central Bank meeting that the US economy is approaching the two goals of the Fed: full employment and stable prices. Considering the continued and robust labor market and the Fed's outlook for economic activity and inflation, it is believed that the situation in recent months has increased the likelihood of a rate hike and her concerns are fading. Although the economic growth rate is not fast, it is enough to further improve the labor market. Although Yellen’s speech has increased the market’s interest rate hike expectations, we feel that the market’s expectations for the Fed’s rate hike have been clearly overdrawn. China's economic and financial data declined in July, and the added value of industrial enterprises above designated size declined slightly. However, the industrial structure was continuously optimized, and the effect of de-capacity was obvious. The decline in fixed-asset investment was partly due to the factor of de-capacity, but the decline in private investment reflected the current lack of economic power. The investment yield is too low; the real estate investment data has declined, but the sales data indicates that the real estate sales are still strong, the destocking effect continues to show, the real estate growth rate is comprehensively and continuously falling, and the period of rapid development of the real estate market has passed. In the future, the demand for real estate real estate will continue to weaken, and real estate investment will also slow down. For consumption, consumption has been maintaining high growth under the pressure of economic downturn. However, due to the popularity of real estate at the beginning of the year, it has virtually weakened the spending power of residents, and of course has a certain relationship with this year's floods and disasters. The fall in financial data is not only related to China's current neutral monetary policy, but also reflects the weak willingness of enterprises to borrow. As an important part of the Keqiang Index, there has been a large increase in power generation in July, which is also a positive signal in the economic downturn. The next step is to increase fiscal policy, especially in infrastructure. Monetary policy has remained basically stable, creating a relaxed environment for fiscal policy. In the second half of the year, the supply pressure of copper mines is still relatively large, mainly from Chile, Peru and other regions, which maintains mine production by compressing operating costs. The processing fee has increased compared with the beginning of the year, and the smelter operating rate has remained high, which has led to the gradual transmission of loose copper concentrate to the refined copper market, resulting in the continued supply of refined copper. In 2016, many industries will enter the destocking stage. Due to the continuous decline of new housing starts and the completion of housing, the consumption of household appliances such as air conditioners is still weak. Although the grid investment is relatively stable, it is difficult to increase significantly. Overall, the future copper market Consumption is still weak. After the short-term sharp decline in copper prices, both long and short positions have been closed. The short-term downward space is limited. The probability of maintaining shocks is too large. The previous short-term orders can partially take profit. The strategy of buying zinc and selling copper can continue to be held. Obviously, pay attention to the opportunities of copper and zinc inside and outside the disk. Possible risks: China's economic recovery, the sharp depreciation of the renminbi, geopolitics and other factors have caused copper prices to fluctuate significantly. Guomao Futures Pu Honggang Sofa Upholstery,Upholstery Fabric,Sofa Fabric Material,Sofa Upholstery Fabric Tongxiang Luchang Textile CO.,LTD , https://www.luchangtextile.com
Client